Team Members
- Nate Crain — e-Portfolio Link
- Srini Dadi — e-Portfolio Link
- Nick Falls — e-Portfolio Link
Overview
This was a group project for Computing II created by Nate Crain, Srini Dadi, and Nick Falls. The goal of our project was to build a tool that lets grid planners forecast energy demand across three different time horizons and then optimize the generation mix based on either cost or carbon emissions. The final product is a Vaadin web app backed by three separate machine learning models and a linear program optimizer.
What the App Does
The user selects one of three planning horizons from a dropdown:
- Short term (SPP grid planner) — forecasts hourly electricity demand 1–36 hours ahead for the Southwest Power Pool using a Gradient Boosted Tree model trained on weather data
- Medium term (1–3 years) — forecasts monthly demand using a General Additive Model (GAM) written in R
- Long term (1–5 years) — forecasts total US energy consumption by year using a Random Forest model trained on historical economic and demographic data
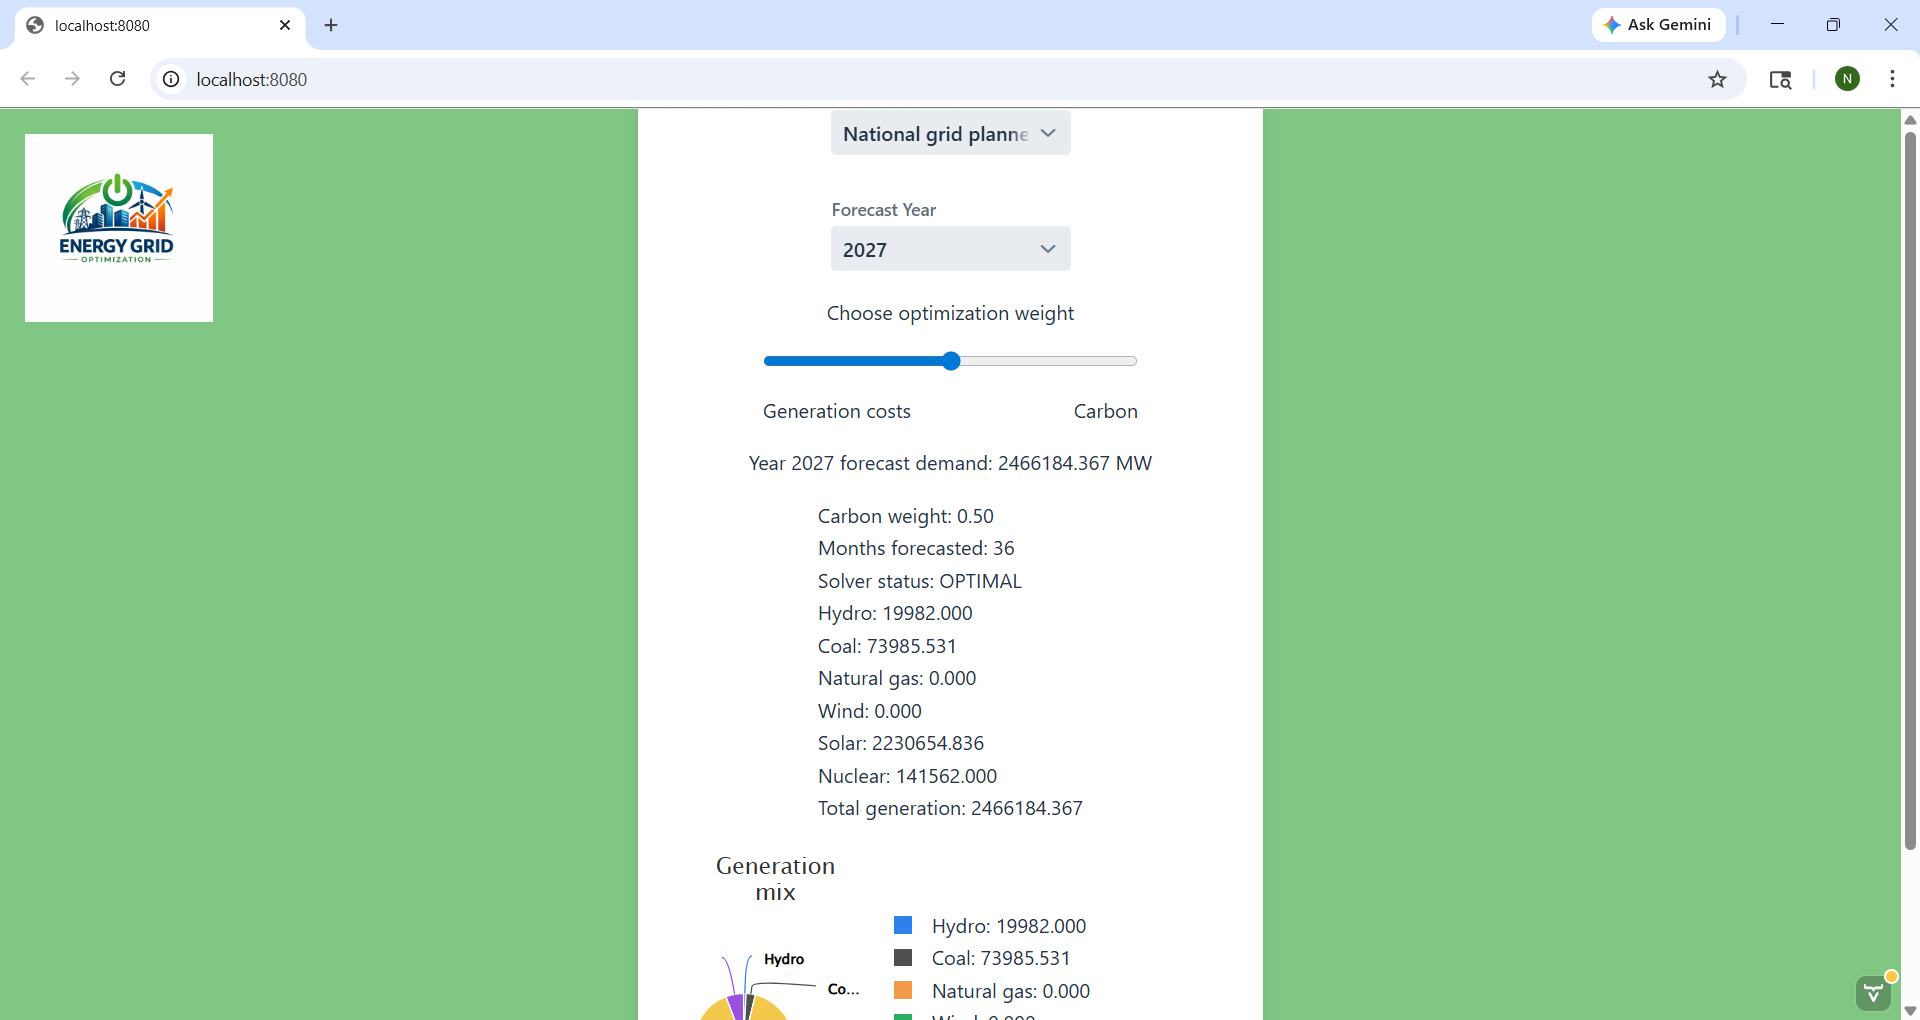
After selecting a forecast, the user adjusts a slider between generation cost and carbon emissions. A linear program then finds the optimal mix of generation sources (hydro, coal, natural gas, wind, solar, nuclear) and displays the result as a pie chart.
My Contribution
My specific contribution was the long term forecasting model (EndUse.java) and integrating it into the Vaadin UI.
The EndUse Model
The dataset contained annual US energy consumption from 1949–2024 broken down by sector (Residential, Commercial, Industrial, Transportation) along with economic indicators including GDP, GDI, population, and the Industrial Production Index.
The first step was constructing the target variable by summing the four sector columns into a single TotalEnergy column. The sector columns were then removed from the feature set to avoid data leakage. The model would have just learned to add them up rather than learning the underlying relationships.
DoubleColumn total = energyConsumption.doubleColumn("Residential")
    .add(energyConsumption.doubleColumn("Commercial"))
    .add(energyConsumption.doubleColumn("Industrial"))
    .add(energyConsumption.doubleColumn("Transportation"))
    .setName("TotalEnergy");
The main challenge with using Random Forest for forecasting is that it cannot extrapolate beyond the range of its training data. To solve this I built separate OLS linear trend models for each predictor variable (GDP, population, GDI, Industrial Production Index) using the historical data. These trend models project each variable forward to the target year, and those projected values are then fed into the Random Forest as inputs.
this.popTrend = OLS.fit(Formula.of("Pop ~ Year"), df);
this.gdpTrend = OLS.fit(Formula.of("GDP ~ Year"), df);
this.gdiTrend = OLS.fit(Formula.of("GDI ~ Year"), df);
this.ipiTrend = OLS.fit(Formula.of("Industrial Production Index ~ Year"), df);
The forecasting pipeline is exposed as a single predictYear(int year) method that takes a year between 2025-2029, generates projected predictor values using the trend models, builds a single-row feature table, and returns the Random Forest prediction. The model achieved a test RMSE of roughly 1,900–2,900 Trillion Btu, which is around 4% off of recent historical values around 73,000–76,000 Trillion Btu.
Limitations I Discovered
Through building this I learned that Random Forests interpolate rather than extrapolate. Predictions for years far beyond the training range eventually plateau at a fixed value because the model has no concept of values outside what it was trained on. This is why I limited the forecast range to 2025–2029 where the predictions are still meaningful. If starting over I would use a linear regression model for this use case since it extrapolates naturally.
Vaadin Integration
I integrated the model into the shared MainView.java Vaadin interface. The EndUse object is installed once when the page loads (training the model), and the predictYear() method is called each time the user changes the year selector. The forecast output is converted from Trillion Btu to Megawatts before being passed to the shared linear program optimizer so it could produce the same generation mix pie chart as the other two models.
double predictionTrillionBtu = endUseModel.predictYear(selectedYear);
double predictionMw = predictionTrillionBtu * 293071.07 / 8760;
I also contributed to the overall UI styling — adding the card layout, green background, styled buttons, and the reset button that clears all selections back to the default state.
My Teammates’ Contributions
- Short term model — Gradient Boosted Tree trained on hourly weather data weighted by metropolitan area population across the Southwest Power Pool
- Medium term model — General Additive Model written in R, called from Java via a process builder, reading predictions from a CSV output file
- Linear program optimizer — paired with all three models, with constraints that change based on time horizon to reflect realistic build times for different generation sources
- Vaadin UI structure — the core layout, pie chart, carbon weight slider, and multi-model listener logic
Screenshots